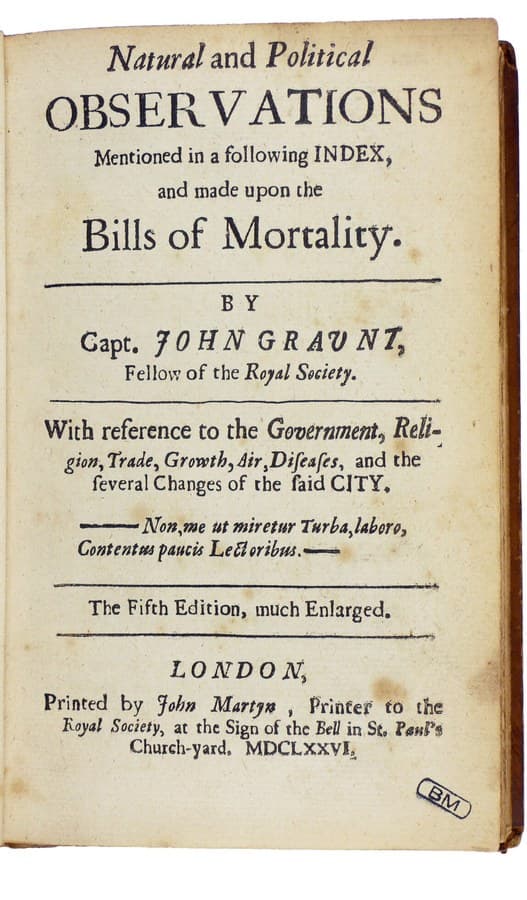
A haberdasher counting London burial records in 1662 found the sex difference in mortality before anyone had a theory for it. The best modern estimate of how much of it is biological comes from a Bavarian monastery.
Women outlive men in almost every population that has been measured. The fact is so familiar that it usually arrives without a number attached, and when a number does arrive it is treated as a constant of nature. It is not a constant. It moves by decade and by country, it was much smaller a century ago, and most of it is not biological.
The second half of the observation is less familiar and more uncomfortable. Those extra years are not, on average, healthy years. Women report worse health than men through most of adult life, score lower on physical performance tests, and carry more of the illness that disables without killing. This is the male-female health-survival paradox, and it is the sharpest evidence anywhere that living longer and living well are different outcomes with different causes.
Why This Matters
If you take healthspan seriously as a separate target from lifespan, you need at least one clean case where the two come apart. The sex difference is that case, at population scale, replicated across every country with usable records.
It also matters because the two halves invite opposite mistakes. Read only the mortality half and you conclude that female biology is protective and men should be studied to find out what they lack. Read only the morbidity half and you conclude that women are sicker and their reports are unreliable. Both readings are available in the popular coverage. Neither survives the primary literature.
How To Read The Numbers In This Article
This piece leans on four kinds of number, and three of them are routinely misread. Four minutes here will make the rest of it work.
Life expectancy is not a prediction about a person. Life expectancy at birth is a summary of this year's death rates at every age, applied to an imaginary newborn who will experience today's mortality forever. Nobody lives through that world. When US life expectancy fell during the pandemic, it did not mean anyone's personal remaining years fell. It meant that year's death rates were worse. Treat it as a scoreboard for a population in a period, not as a forecast.
Remaining life expectancy at age X is a different, and often more useful, number. "Remaining life expectancy at age 25" ignores everything that happened before 25, which matters enormously when you are comparing groups that differ in infant and childhood mortality. When a study reports a gap "at young adult ages", it has deliberately removed the early-life deaths from the comparison.
A mortality ratio compares rates, not counts. A male-to-female mortality ratio of 1.5 at ages 50 to 70 means men in that age band were dying at 1.5 times the female rate. It says nothing on its own about how many people that is. A ratio of 1.0 is the no-difference point.
A DALY is a year of healthy life lost, and it combines two things. One disability-adjusted life year is one year lost either to early death or to living with illness. Reported per 100,000 people, it lets a condition that kills and a condition that disables be put on one axis. That is its power and also its trap: a large DALY figure does not tell you whether the years were lost to dying or to suffering. For the sex comparison, that distinction is the entire story, so this article separates the two wherever the source does.
Averages here hide enormous overlap. A five-year difference in group means sits on top of two distributions that overlap almost completely. Plenty of individual men outlive plenty of individual women. Nothing in this article predicts anything about one person.
The Two Facts, Stated Precisely
Fact one: women die later. In the United States the gap between female and male life expectancy was 5.8 years in 2021. That is the widest it had been since 1996, and it had been narrowing before that, down to 4.8 years in 2010. The widening from 2019 was driven mostly by COVID-19, then by unintentional injuries and poisonings, which is mostly drug overdose, then by accidents and suicide.
Elsewhere the gap is bigger or smaller by a lot. In Russia in 2009 it was 12 years, 74.7 for women against 62.7 for men. A gap that ranges from about three years to about twelve across countries in the same decade is not being set by chromosomes.
Fact two: women report worse health while alive. Men are, on average, physically stronger, report fewer disabilities and perform better on physical function tests, and die earlier at every age. That combination is the paradox, and it has been the standing description in the field since at least 2008.
Two facts, both solid. Everything worth arguing about is in the explanation.
The Cloister Experiment
The obvious confound in every comparison of men and women is that men and women do not live the same lives. They smoke differently, drink differently, drive differently, work differently, and present to doctors differently. To isolate biology you would need two groups matched on all of it, differing only in sex.
That experiment exists, and nobody had to run it. Catholic religious orders put men and women into near-identical environments: same schedule, same food, same work, same housing, same abstention from tobacco and alcohol, same absence of occupational hazard, same lifelong access to the same care.
Marc Luy assembled mortality data on more than 11,000 Bavarian nuns and monks covering 1890 to 1995 and compared them with the general German population over the same span. The result is the single most useful number on this topic.
Under those matched conditions, the female advantage was no more than one year of remaining life expectancy at young adult ages. Not five. About one.
The second half of the result is what makes it decisive. In the general German population the sex gap widened considerably after the Second World War. Inside the cloisters it stayed almost flat across the whole 105 years. And the divergence came from one side: men in the general population failed to follow the mortality improvement that women, nuns and especially monks all achieved. The gap did not open because women pulled ahead. It opened because men outside the monastery stopped keeping up.
The Gap Is Younger Than It Looks
If the modern gap were mostly biological you would expect it to be old. It is not.
Beltrán-Sánchez, Finch and Crimmins reconstructed mortality for 1,763 birth cohorts born between 1800 and 1935 across 13 countries. For cohorts born before 1880 the male-to-female mortality ratio sits near 1.1, which is a small male disadvantage. Then it climbs, by as much as 50 percent, and the climb is concentrated in a specific age band: 50 to 70.
Two things explain most of the climb. The first is heart disease, which becomes the main condition associated with excess male mortality for cohorts born after 1900. The second is tobacco: smoking accounts for roughly 30 percent of the excess male mortality at ages 50 to 70 for cohorts born between 1900 and 1935.
So the shape is this. Infectious mortality fell. Diets and daily life changed. Men took up cigarettes decades before women did and in far greater numbers. What emerged underneath was a male vulnerability to cardiovascular disease that had previously been hidden by everyone dying of something else first. The five-year gap is a twentieth-century object.
What Survives When Behaviour Is Removed
Luy's one year is a ceiling on the biological contribution under one particular set of conditions. The floor comes from a different direction, and it is the strongest biological evidence in the field.
Virginia Zarulli and colleagues went looking for populations where mortality was so extreme that behavioural differences would be swamped. They found seven: famines, epidemics and slavery. Their finding, in their own words, is that women "had lower mortality across almost all ages, and, with the exception of one slave population, they lived longer on average than men."
The decisive detail is which ages contributed most. It was infants. Newborn girls survived catastrophic conditions better than newborn boys, and that difference contributed more to the life expectancy gap than any adult difference did. Newborns do not smoke, drive, drink or avoid doctors. A survival difference at that age is not a lifestyle difference.
Zarulli's own conclusion holds both halves at once: the advantage is biologically grounded, and it "differs across environments and is modulated by social factors." That is the correct summary of the whole literature. Biology sets a floor of roughly a year. Everything above that is supplied by the world.
It is worth noting how unusual humans are here. Across intensively studied species, sex differences in longevity are conditional, flipping with environment and circumstance. Humans appear to be the only species in which one sex holds a survival advantage that shows up essentially everywhere.
The Testosterone Story, And Why It Is Thinner Than It Sounds
The most-shared piece of evidence for a hormonal explanation is a study of Korean eunuchs. It deserves a careful reading, because it is repeatedly quoted as settling something it does not settle.
Min, Lee and Park reconstructed lifespans for 81 eunuchs from court genealogy records. Mean lifespan was 70.0 years, with a standard error of 1.76, against comparison groups of similar social rank whose means ranged from 50.9 to 55.6 years. Three of the 81 reached 100. The authors read it as support for male sex hormones shortening male life.
Now the problems. Eighty-one men is a small sample for a claim this large. There is no randomisation and no individual matching, only comparison with families of similar rank. And the confound is glaring: palace eunuchs lived inside the palace, with food security, shelter, and freedom from the physical hazards of ordinary labour, in a period when those things moved lifespan enormously. A 15-year difference in that setting is compatible with castration doing a great deal, and equally compatible with it doing very little while the palace did the work.
Treat it as a reason to keep the hormonal hypothesis on the table. Do not treat it as a measurement.
Is The Morbidity Half Real, Or Is It Reporting?
Here is where the popular coverage most often goes wrong, in both directions.
The suspicion is reasonable on its face. Self-rated health is self-reported. Women consult doctors more, receive more diagnoses, and are more likely to have a condition named. If men underreport and underconsult, the female "excess" in illness could be an artefact of who says what.
Anne Case and Christina Paxson tested exactly this across 14 years of the US National Health Interview Survey, and the answer is clean. Women do have worse self-rated health and more hospital episodes than men from early adolescence to late middle age, while being less likely to die at each age. But the difference in self-assessed health between the sexes is entirely explained by the distribution of chronic conditions each faces. Men and women carrying the same chronic conditions rate their own health the same.
That kills the reporting-bias story. Women are not describing the same body differently. They are describing a different distribution of illness accurately.
The same paper contains the mirror-image finding, and it is the one that closes the loop. The equivalence does not hold for hospitalisation and death. Men with several smoking-related conditions, including cardiovascular disease and certain lung disorders, were more likely to be hospitalised and to die than women with the same named condition. Same diagnosis on the chart, worse course.
So the paradox resolves into two separate mechanisms rather than one:
- Women get more of the conditions that persist and disable. Musculoskeletal pain, depression, headache, autoimmune disease.
- Men get worse outcomes from the conditions that kill, even at the same diagnosis.
Neither of those is a statement about who complains.
What The Global Burden Data Adds
The GBD 2021 analysis of sex differences across the top 20 causes of disease burden makes the split visible at scale, and it is the most quantitative version of the point.
Female excess, in additional disability-adjusted life years per 100,000:
- Low back pain: 478.5
- Depressive disorders: 348.3
- Headache disorders: 332.9
Male excess, same units:
- COVID-19: 1,767.8
- Ischaemic heart disease: 1,611.8
- Road injuries: 1,012.2
Look at what is in each column. The female list is conditions that last for years and rarely appear on a death certificate. The male list is conditions that end lives. The magnitudes differ because the units are dominated by years of life lost when a condition kills, which is exactly why the two columns should not be compared as if they measured the same thing.
Two further details from that analysis are worth carrying. The differences between the sexes grow with age for nearly every condition, which is consistent with accumulation rather than with a fixed constitutional difference. And there is a striking exception to the general pattern: HIV/AIDS, where females aged 25 to 49 in sub-Saharan Africa carry 1,724.8 more DALYs per 100,000 than males. A biology-first account of sex differences in health has to explain why the exception is geographic.
The Confounder Nobody Adjusts For
One caution that most secondary coverage skips, and that changes how much weight the morbidity half can carry.
At age 80, comparing men to women is not comparing like with like. The men who reached 80 passed through three decades of substantially higher mortality than the women beside them. They are the survivors of a harsher filter. Survivors of harsher filters are, on average, hardier than the population they were drawn from.
This biases old-age comparisons in a specific direction: it makes surviving men look healthier relative to women than the underlying sexes actually are, and therefore makes the female health disadvantage look larger than it is. The effect is real and it is not usually adjusted away.
It is also why the strongest evidence in this article comes from adolescence to late middle age, where the filter has barely operated. When you see a claim about the sex health gap that rests entirely on the over-75s, discount it.
The Study That Would Settle This
Three measurements would move this from a well-argued position to a settled one, and none of them is exotic.
Replicate the cloister design somewhere else. Luy's result is the load-bearing number in this whole article, and it rests on one country, one religion and one century. Other closed populations exist where men and women live to a shared rule. Running the same comparison in two or three of them would tell you whether "about one year" is a constant of human biology or a feature of Bavarian monastic life. Until that is done, treat the one year as a well-sourced single estimate rather than as a replicated finding.
Decompose a modern cohort and publish the residual. Beltrán-Sánchez and colleagues did this for historical cohorts and got a number for tobacco's share. Nobody has done the equivalent for people alive now: take the current gap in a given country, subtract the part attributable to smoking, to cardiovascular risk factors, to road deaths, to overdose and to suicide, and report what is left with an interval around it. That residual is the biological estimate. It is the number everyone in this debate is arguing about, and it is not being measured directly.
Publish healthy life expectancy by sex. This is the most fixable gap on the list, and its absence is why the second half of this article is built from cause-level burden rather than from a single headline figure. WHO reports healthy life expectancy combined across the sexes. The GBD 2021 analysis reports it by development level. The sex split is computable from data both organisations already hold. Publishing it would let anyone check, in one number, the claim that women spend more years in poor health, which is currently asserted far more often than it is sourced.
The pattern here is the same one that shows up in the menopause literature: the confident claim is old, widely repeated, and resting on a measurement nobody has actually made.
What This Leaves You With
The gap is mostly not biology. Matched environments leave about a year. The observed gap runs from three to twelve years depending on where you look, and the difference between one and twelve is made of tobacco, cardiovascular risk, violence, road traffic, overdose and suicide.
Biology is not zero either. Newborn girls out-survive newborn boys in famines. That floor is real, and it is small.
The gap is not a constant, and it is not monotonic. It narrowed in the US to 2010 and then widened to 5.8 years by 2021. A number that reverses direction within a decade is being driven by conditions, not constitution.
Extra years are not free years. Women's longer survival comes with more years carrying conditions that disable, and the conditions themselves differ rather than the willingness to report them.
The two sexes have different top priorities, and the evidence names them. For men, the excess is concentrated in cardiovascular disease at ages 50 to 70, tobacco, and external causes. Those are the most modifiable categories in all of public health. For women, the burden is musculoskeletal, mental and neurological, which are chronic, undertreated, and largely absent from the mortality statistics that drive funding. This is also why sex-stratified results matter in trials: an intervention that moves one column may do nothing for the other.
The thing worth keeping is the shape of the finding. Two populations, one living five years longer, the other living better while alive, and neither pattern explained by a single hallmark of aging. Lifespan and healthspan pull apart in the largest natural experiment we have. Anything that treats them as one number is measuring the wrong thing.
Frequently Asked Questions
Why do women live longer than men?
Mostly because of what happens to men rather than what protects women. Under matched living conditions the female biological advantage is about one year. The rest of the observed gap comes from cardiovascular disease at ages 50 to 70, tobacco, road injuries, overdose and suicide, all of which fall more heavily on men in most societies.
Is the difference genetic?
Partly, and less than usually claimed. The clearest biological signal is that newborn girls survive famine and epidemic conditions better than newborn boys, at an age where behaviour cannot explain it. Candidate mechanisms include the second X chromosome and hormonal differences, but no human study has yet quantified how much of the adult gap any single mechanism supplies.
Do women really have worse health, or do they just report it more?
They really have it. Across 14 years of US survey data, men and women with the same chronic conditions rated their own health identically. The difference is in which conditions each sex develops, not in how each describes them.
Is the gap getting smaller?
It depends on when and where. In the United States it narrowed to 4.8 years by 2010 and then widened to 5.8 years by 2021, the widest since 1996. Treat any claim of a steady global trend with suspicion.
If men are the disadvantaged ones on mortality, why is this filed under women's health?
Because the paradox is a statement about both, and only one half of it is usually told. The mortality half is well known. The half where women spend more of a longer life carrying conditions that disable, that get less research money precisely because they do not kill, is the half that goes missing.
Funding Transparency
This article received no funding. Longevity Science Daily has no commercial relationship with any manufacturer of hormone therapy, diagnostics or supplements, and none are recommended here. No sources were compensated. The author has no financial interest in any product or company mentioned.
On the funding behind the research itself: the Global Burden of Disease programme is funded by the Bill and Melinda Gates Foundation, which is disclosed in every GBD publication. The historical cohort work cited here (Luy, Zarulli, Beltrán-Sánchez) was supported by national research councils and university funding rather than by industry, which is the usual pattern in demography and one reason this literature is less commercially distorted than most of the longevity field.
Every figure above was read in the primary publication or its abstract. Five claims were dropped during research because no primary source could be resolved, including a single global sex-split figure for years lived in poor health, and four more were removed after an adversarial verification pass. Those are recorded with reasons in the research notes for this article.
Related Reading
- Why Women's Health Is Longevity Science
- Menopause Moves Bone and Lipids. No Clock Study Exists.
- Healthspan vs Lifespan
- The Diabetes Drug That Extended Lifespan in Males and Did Nothing in Females
- The Hallmarks of Aging
- VO2 Max From First Principles
- Cellular Senescence
Written with the help of AI tools, shaped and verified by humans. Every number in this article was checked against the primary publication rather than a summary of it.
This article is for information only and is not medical advice.
Sources
- Luy M. Causes of male excess mortality: insights from cloistered populations. Popul Dev Rev. 2003;29(4):647-676. DOI: 10.1111/j.1728-4457.2003.00647.x
- Zarulli V, Barthold Jones JA, Oksuzyan A, Lindahl-Jacobsen R, Christensen K, Vaupel JW. Women live longer than men even during severe famines and epidemics. Proc Natl Acad Sci USA. 2018;115(4):E832-E840. DOI: 10.1073/pnas.1701535115
- Beltrán-Sánchez H, Finch CE, Crimmins EM. Twentieth century surge of excess adult male mortality. Proc Natl Acad Sci USA. 2015;112(29):8993-8998. DOI: 10.1073/pnas.1421942112
- Case A, Paxson C. Sex differences in morbidity and mortality. Demography. 2005;42(2):189-214. DOI: 10.1353/dem.2005.0011
- Oksuzyan A, Juel K, Vaupel JW, Christensen K. Men: good health and high mortality. Sex differences in health and aging. Aging Clin Exp Res. 2008;20(2):91-102. DOI: 10.1007/BF03324754
- Patwardhan V, Gil GF, Arrieta A, et al. Differences across the lifespan between females and males in the top 20 causes of disease burden globally: a systematic analysis of the Global Burden of Disease Study 2021. Lancet Public Health. 2024. DOI: 10.1016/S2468-2667(24)00053-7
- Yan BW, Arias E, Geller AC, Miller DR, Kochanek KD, Koh HK. Widening gender gap in life expectancy in the US, 2010-2021. JAMA Intern Med. 2024;184(1):108-110. DOI: 10.1001/jamainternmed.2023.6041
- Austad SN, Fischer KE. Sex differences in lifespan. Cell Metab. 2016;23(6):1022-1033. DOI: 10.1016/j.cmet.2016.05.019
- Min KJ, Lee CK, Park HN. The lifespan of Korean eunuchs. Curr Biol. 2012;22(18):R792-R793. DOI: 10.1016/j.cub.2012.06.036
- Crimmins EM, Shim H, Zhang YS, Kim JK. Differences between men and women in mortality and the health dimensions of the morbidity process. In: Sociality, Hierarchy, Health: Comparative Biodemography. National Academies Press; 2014. NCBI Bookshelf NBK242444
- GBD 2021 Diseases and Injuries Collaborators. Global incidence, prevalence, years lived with disability, disability-adjusted life-years, and healthy life expectancy for 371 diseases and injuries in 204 countries and territories, 1990-2021. Lancet. 2024. DOI: 10.1016/S0140-6736(24)00757-8
- Graunt J. Natural and Political Observations Made upon the Bills of Mortality. London; 1662. Digitised copy, Internet Archive